


Forecast value of separate clinical and laboratory indicators acute lymphoblastic leukemia in children received cytostatic therapy ALLIC BFM 2009
Summary. Aim. The investigatation of the prognostic value of individual clinical and laboratory parameters of acute lymphoblastic leukemia in children receiving cytostatic therapy ALLIC BFM 2009. Methods. Analysis of the clinical picture of patients on the basis of laboratory tests (general analysis of blood and urine, cytological tests, biochemical analysis of blood, flow cytometry using monoclonal antibodies), statistical analysis. Results. The individual clinical and laboratory parameters of patients who received cytostatic therapy ALLIC BFM 2009 with an assessment of their prognostic value were analyzed. Conclusions. Generalized analysis of prognostic factors using the ALLIC-BFM 2009 protocol for the treatment of children with acute lymphoblastic leukemia in children is important to improve the results of their treatment.
DOI: 10.32471/clinicaloncology.2663-466X.41-1.28120
Submitted 16.04.2021
Аccepted for publication 17.05.2021
While most children and adolescents with initially diagnosed acute lymphoblastic leukemia (ALL) recover, 10–20% of patients develop a relapse. The application of the protocol for the treatment of children with ALL of the international group BFM — ALLIC-BFM 2009 is based on the immunocytological determination of the molecular residual disease (MRD) with the patients belonging to one or another risk group. The patient with an improvement in the overall outcome of their treatment depending on the response to treatment, stratification of children occurs on the basis of prognostic factors in order to improve the cure rate (for those at high risk of relapse) and minimize the morbidity associated with treatment (for patients with low risk).
Therefore, a generalized analysis of prognostic factors when using the ALLIC-BFM 2009 protocol for treating children with ALL is important for improving the results of their treatment.
MATERIALS AND METHODS
105 patients with ALL aged 1 to 18 years, who received chemotherapy ALLIC BFM 2009. Children were admitted to primary inpatient treatment from 11.05.2012 until June 13, 2016. Monitoring of long-term results was discontinued on July 1, 2019. The diagnosis of ALL was established on the basis of the clinical picture, laboratory tests: general blood and urine analysis, cytological (counting hemogram and myelogram, cerebrospinal fluid cytosis, in preparations performed on cytospin, in panoptically stained smears according to May-Grunwald — Giemsa), biochemical blood analysis, cytochemical reactions were carried out, immunophenotype studies by flow cytometry using monoclonal antibodies (MCAT). The totality of surface and cytoplasmic markers was the basis for the establishment of linear affiliation, the isolation of maturity stages of precursors of B- or T-lymphocytes.
A number of immunological variants were identified, which determine the cellular nature of leukemia and the level of differentiation block in neoplastic populations, on the basis of the criteria for the common classifications of the blast phenotype correspondence. Antigen expression was considered positive when the proportion of blasts on the surface of which the antigen was located was at least 20.0% for lymphoid and linear-independent and 30.0% for myeloid markers. Therefore, further in the tables and in the text, the entire analysis of the material, including the statistical one, was carried out taking into account these boundaries. Imaging methods were used: chest x-ray, ultrasound (ultrasound), if necessary — computed tomography and/or magnetic resonance imaging of the head, chest organs, abdomen, puncture biopsy of bone marrow. An independent study of drugs and the determination of MRD was carried out in the reference laboratory of the NDSKL «OKHMATDYT» (Kyiv).
For the analysis, the statistics program Statistica for Windows 8.0 (Statsoft, USA) was used. The event-free survival (EFS) function is calculated by the Kaplan — Meier method. Comparison of survival between groups was carried out with the employer Coxs-F-test.
The research was carried out in accordance with the principles of the Declaration of Helsinki. The research protocol was adopted by the Local Ethics Committee of the institutions. The informed consent of the parents of the children was obtained for the research.
RESULTS AND DISCUSSION
Among the surveyed there were 62 boys (59.0%) and 43 — girls (41.0%), the ratio was 1.4:1. The median (Med) age of patients was 6 years (fluctuations from 12 months to 16 years old), including the boys’ Med age was 7 years. 4 months (fluctuations 12 months — 16 years) and girls — 6 years old. 4 months (fluctuations 12 months — 15 years) (Table 1). Med of observation for all patients was 63.0 months. (fluctuations 0–85.5 months), Med duration of remission — 58.0 months.
According to the main parameters of bone marrow and peripheral blood in children with ALL, the diagnosis was temporarily established (Table 1), the Med of the hemoglobin index (g/l) was 89.00 (fluctuations 40.00–162.00), among them in girls — Med 87.00 (fluctuations 40.00–151.00), in boys — 89.00 (fluctuations 40.00–162.00) Med of the content of bone marrow blasts (%) was 87.40 (fluctuations 29.90–100.00): for girls 89.2 (fluctuations 29.90–100.00), for boys 86.85 (45.70–100 00) Med of the blood lecoctival index (g/l) of children with ALL was 13.80 (fluctuations 1.40–96.80), where Med 12.90 (fluctuations 1.50–96.80) and 14.70 (fluctuations 1.40–96.00) for girls and boys, respectively; Med of blood blast content (%) was 53.0 (fluctuations 0.0–99.70), where Med of blood blasts (%) in girls was 48.00 (fluctuations 2.00–99.00), and in men.
Table 1. Basic parameters of bone marrow and peripheral blood in children with ALL at the time of diagnosis
| Parameters | All patients
n=105 |
Girls
n=43 |
Boys
n=62 |
|
| Age | Med | 6 years | 6 years 4 mon. | 7 years 4 mon. |
| Min–max | 12 months–16 years | 12 months–15 years | 12 months–16 years | |
| Hemoglobin, g/l | Med | 89.00 | 87.00 | 89.00 |
| Min–max | 40.00–162.00 | 40.00–151.00 | 40.00–162.00 | |
| Bone narrow’s blasts, % | Med | 87.40 | 89.2 | 86.85 |
| Min–max | 29.90–100.00 | 29.90–100.00 | 45.70–100.00 | |
| Blood leukocytes, g/l | Med | 13.80 | 12.90 | 14.70 |
| Min–max | 1.40–96.80 | 1.50–96.80 | 1.40–96.00 | |
| Blood blasts, % | Med | 53.0 | 48.00 | 63.00 |
| Min–max | 0.0–99.70 | 2.00–99.00 | 0.0–99.70 | |
| Blood blasts, g/l | Med | 6.55 | 6.14 | 7.09 |
| Min–max | 0.0–82.28 | 0.06–82.28 | 0.0–65.07 | |
A good response to initial prednisolone therapy (prednisolon good response), when the absolute number of blasts on the eighth day of the protocol was less than 1.0 g/L, was noted in the majority of patients — 89 (84.76%) people. 15.24% of children, the number of blasts in the peripheral blood was more than 1.0 g/l prednisolon poor response (Table 2).
Table 2. Analysis of the specific response to therapy with the distribution of patients in therapeutic risk when using the ALL IC-BFM2009 treatment program
| Treatment program | 8th day | 15th day | Early death (till 33rd day) | 33th day (blasts in the myelogram >5.0%)* | 33th day (blasts in the myelogram <5.0%)* | 33th day, MDR >0.01% | SRG | IRG | HRG |
| Response to treatment | PPR | NR, MDR ≥10% | NR | Remission | |||||
| All n=105 (%) | 16 (15.24) | 22 (20.95) | 2 (1.9) | 1 (0.97) | 102 (99.03) | 12 (11.65) | 5 (4.77) | 65 (61.90) | 35 (33.33) |
Note: *2 dead children before the 33rd day of induction therapy are not taken into account
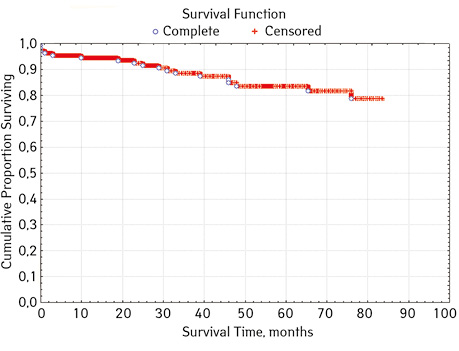
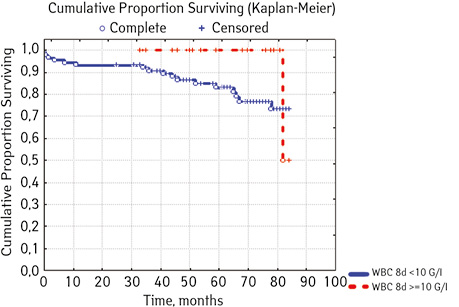
Note that the primary response to initial PRED therapy does not depend on the sex of the sick child (p>0.05). In our study, in contrast to a number of publications, it was found that the EFS index was higher in children with a poor response to prednisolone prephase (EFS 79.5%) compared with individuals in whom the absolute number of blasts on the 8th day of treatment was <1.0 g/L (EFS 71.6%) (p=0.50839). The frequency of achieving bone marrow remission on the 33rd day is quite high (98.04%). Did not respond to induction therapy 2 (1.96%). In 2 (1.90%) patients, early death from septic complications during induction therapy was recorded. The share of EFS for the entire observation period is 78.7±0.05% (Fig. 1–17).
As for individual indicators of bone marrow and peripheral blood of the primary response to induction treatment in children with ALL at the time of diagnosis, the Med of the blood leukocyte count on the 8th day (g/l) was 4.60 (fluctuations 0.02–103.00), among them women had Med 5.20 (fluctuations 0.38–26.50), and men — 4.5 (fluctuations 0.20–103.00) on the 8th day of treatment of the Med parameter of blood blasts was 0.058 (number 0.0–4.11): in girls — Med 0.05 (fluctuations 0.00–2.77), in boys — Med 0.06 (fluctuations 0, 0.0–4.11) Med the percentage of blood blasts on the 8th day (%) was 1.00 (fluctuations 0.00–97.00), where Med in girls was 1.00 (fluctuations 0.00–80.00), in boys — 1.00 (fluctuations 0.00–0.97).
On the 15th day, the main indicators of bone marrow and peripheral blood of the primary response to induction treatment in children with ALL were: Med of blood leukocytes (g/l) — 2.40 (fluctuations 0.60–26.50), among for girls, Med was 2.30 (fluctuations 0.70–26.5), for boys it was 2.40 (fluctuations 0.60–9.50), bone marrow blasts (%) — Med 4.40 (fluctuations 0,00–95.00), while for girls — 4.00 (fluctuations 0.3–44.40), for boys — 2.40 (fluctuations 0.60–9.50) MRD (%) — Med 2, 5 (fluctuations 0.01–52.9), girls 2.7 (fluctuations 0.01–52.9), boys 2.5 (fluctuations 0.01–46.00).
Bone marrow and peripheral blood parameters of children with ALL on the 33rd day of treatment had the following parameters: Med of blood leukocyte count was 2.50 (0.00–17.30), where Med in girls corresponded to 2.8 (fluctuations 0.0–17.30), and the guys; Med of the level of bone marrow blasts (%) was 1.70 (fluctuations 0.0–6.70), among them, girls had Med 1.30 (fluctuations 0.0–5.40), boys — Med 1.95 (fluctuations 0.0–6.7) (Table 3).
Table 3. Selected indicators of bone marrow and peripheral blood of the primary response to induction treatment in children with ALL at the time of diagnosis
| Parameters | All patients
n=105 |
Girls
n=43 |
Boys
n=62 |
|
| Blood leukocytes on the 8th day, g/l | Med | 4.60 | 5.20 | 4.50 |
| Min–max | 0.02–103.00 | 0.38–26.50 | 0.20–103.00 | |
| Blood blasts on the 8th day, g/l | Med | 0.058 | 0.05 | 0.06 |
| Min–max | 0.0–4.11 | 0.00–2.77 | 0.00–4.11 | |
| Blood blasts on the 8th day, % | Med | 1,00 | 1.00 | 1.00 |
| Min–max | 0.00–97.00 | 0.00–80.00 | 0.00–97.00 | |
| Blood leukocytes on the 15th day, g/l | Med | 2.40 | 2.30 | 2.40 |
| Min–max | 0.60–26.50 | 0.70-26.50 | 0.60–9.50 | |
| Blood blasts on the 15th day, % | Med | 4.40 | 4.00 | 0.00 |
| Min–max | 0.00–95.00 | 0.30–44.40 | 0.00–33.00 | |
| MRD on the 15th day, % | Med | 2.5 | 2.70 | 2.50 |
| Min–max | 0.01–52.9 | 0.01–52.90 | 0.01–46.00 | |
| Blood leukocytes on the 33th day, g/l | Med | 2,50 | 2.8 | 0.04 |
| Min–max | 0.00–17.30 | 0.0–17.30 | 8.10–1.97 | |
| Bone narrows blasts on the 33th day, % | Med | 1.70 | 1.30 | 1.95 |
| Min–max | 0.0–6.70 | 0.0–5.40 | 0.0–6.70 | |
| MRD on the 33th day, % | Med | 0.00 | 0.00 | 0.00 |
| Min–max | 0.00–11.00 | 0.00–3.50 | 0.00–11.00 | |
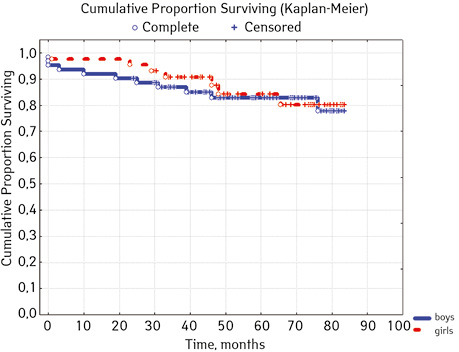
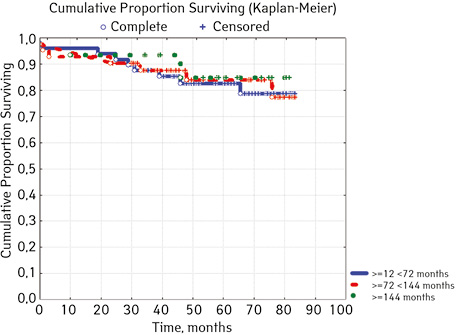
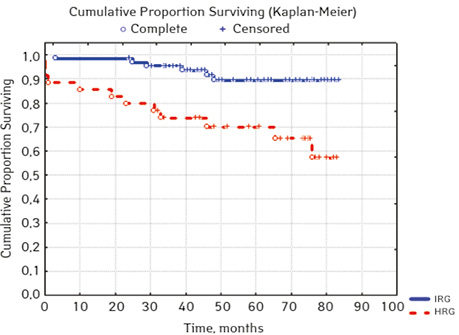
According to the clinical and laboratory characteristics of the prognosis of ALL in children, events were in 17.14% (n=18), treatment without incidents — in 82.86% (n=87). The distribution by sex was as follows (p=0.61): among young men n=62, events were recorded in 17.14% (n=11), without incidents — 82.26% (n=51), EFS — 82.2%; among girls, events were in 16.28% (n=7), without accidents — in 83.72% (n=36), EFS — 84.1%. For risk groups (p=0.001), the standard-risk group low-risk group (SRG) included 5 people, where no events were recorded and EFS was 100%; group of intermedium-risk group (IRG) n=65, among which 9.23% had events (n=6) and no events — 90.77% (n=59), EFS — 89.2%, taking into account that p=0.00137 reliably compared to the high-risk group (HRG), 35 people were included in HRG, where events were in 34.29% (n=12), without incidents 65.71% (n=23), EFS — 52.7%… By age, the picture was as follows (p=0.89): in the category of 12-72 months (n=48), there were events in 18.75% (n=9), without incidents — 81.25% (n=39), EFS — 77.9%; in the 72–144th group (n=42), events were recorded in 16.67% (n=7), without incidents 83.33% (n=35), EFS — 73.1%; in persons over 144 months (n=15): in 13.33% (n=2) events were recorded, 86.6% (n=13) without events with EFS 85.2%.
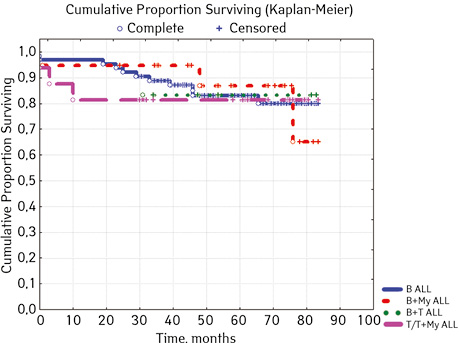
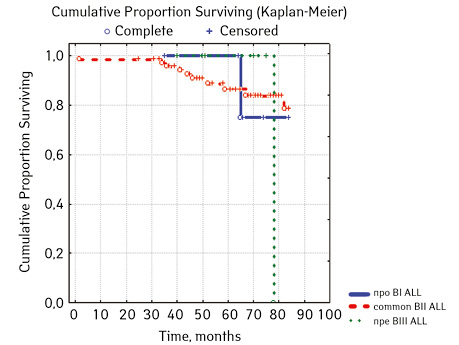
Considering ALL variants (p=0.94896), then in the ARVI group (n=8) the proportion of events was 25.0% (n=2), without incidents — 75.0% (n=6), EFS=50%; in Common BII (n=75): events were in 14.67% (n=11), without incidents — 85.33% (n=64), EFS — 79.4%; in Pre VII (n=6) in 33.33% (n=2) there were events, without incidents in 66.7% (n=4), EFS — 66.7%; in the group of variant T (n=16), events were in 18.75% (n=3), without accidents in 81.25% (n=13). According to the variants of ALL, depending on the coexpressions of markers at p=0.2700: ALL without coexpressions was detected in 78 patients, among whom 14.67% (n=17.95) had events, without accidents — 85.33% (n=64), EFS — 79.4%; ALL+ CD13+ was diagnosed in 15 people, where 6.67% (n=1) had events, without accidents — 93.33% (n=14), EFS — 90.0%, given that p=0.04314 significant compared to ALL+ CD13+ between ALL+ CD33+; ALL+ CD33+ was found in 2 people, where 50% (n=1) had events and 50% (n=1) had no events, EFS=50%; ALL+ CD13+. CD33+ were verified in 4 children, among them 25% (n=1) had events, 75% (n=3) had no events, but 2 patients from this group died; B+ T ALL was diagnosed in 6 people, 16.67% (n=1) had events, 83.33% (n=5) had no events, EFS=81.8%. According to ALL variants, depending on the coexpressions of markers at p=0.88915: B pure was diagnosed in 64 patients, in 17.18% of cases (n=11) events were recorded, in 82.81% (n=53), EFS=79.6%; B + Mu was detected in 19 children, events were recorded in 15.78% (n=3), in 84.22% of cases (n=16) no events were detected, EFS=61.5%, B + T was detected in 6 patients, among the cases of which 16.67% (n=1) were events, 83.33% (n=5) no events were registered, EFS — 81.8%; T / T + Mu was diagnosed in 16 people, where 18.72% (n=3) showed heart disease, vapidly without incident — 81.25% (n=13), EFS — 81.3%.
Separate blood and bone marrow parameters were analyzed. Blasts (g/L) before treatment (p=0.26312): rate <10 was found in 40 people, 20% (n=8) had events, 80,% (n=32) were without events, EFS — 70.2%: indicator ≥10.0 was registered in 65 people, among whom in 15.38% (n=10) the course was with events, 84.2% (n=55) — without incident, EFS=73.8%… Bone marrow blasts (%) before treatment (c=0.69272) among patients had the following levels: <90.0 found in 55 patients, where 18.8% (n=10) were with events, 81.82% (n=45) without incidents, EFS — 69.4%: 41 children had levels ≥90 <100.0, including 17.07% (n=7) had events, and 82.9% (n=34) there were no events, EFS — 75.9%; the indicator >100 was defined in 9 people, 11.1% (n=1) of which had events, 88.89% (n=8) had no events, EFS=71.4%. Leukocytes (g / l) in patients to treatment had the following levels (p=0.58387) <4.0, 24 were detected, including 12.50% (n=3) were with events, 87.50% (n=21) — no incident, EFS=72.9%; indicator ≥ 4.0 <10.0 was found in 17 people, where 2.53% (n=4) ran over with events, without incidents — 76.47% (n=13), EFS — 67.9%. level ≥ 10.0 <50.0 were registered in 56 children, where 16.07% had events (n=9), no events were in 82.93% of cases (n=47), EFS-80.8%; indicator ≥50.0 was found in 8 people, among whom 25.00% (n=2) were events, disease proceeded without incidents in 75.00% (n=2), EFS — 49.1%. Leukocytes on the 8th day of treatment with p=0.08907 had the following picture: a level <10.0 was diagnosed in 88 Hosea, 19.32% (n=17) of which had events, 81.68% (n=71) there were no events, EFS — 72.1%; level ≥10.0 was found in 17 children, where 5.88% (n=1) were with events, 94.12% (n=16) without events, EFS=50.0%. Blast levels (g / l) on the 8th day of treatment at p=0.50839 had the following prognosis: a level <1.0 fixed (Table 4).
Table 4. Clinical and laboratory features of the prognosis of ALL in children
| Parameters (n=105) | Number of patients, n (%) | Event
n=18 (17,14%) |
No event
n=87 (82,86%) |
EFS, % | р* | |
| Gender | Boys | 62 | 11 (17.74) | 51 (82.26) | 82.2 | 0.6100 |
| Girls | 43 | 7 (16.28) | 36 (83.72) | 84.1 | ||
| Risk group | SRG | 5 | 0 | 5 (100) | 100 | 0.001 |
| IRG | 65 | 6 (9.23) | 59 (90.77) | 89.2 ** | ||
| HRG | 35 | 12 (34.29) | 23 (65.71) | 52.7 | ||
| Age, months, months | ≥12 <72 | 48 | 9 (18.75) | 39 (81.25) | 77.9 | 0.8900 |
| ≥72 <144 | 42 | 7 (16.67) | 35 (83.33) | 73.1 | ||
| ≥144 | 15 | 2 (13.33) | 13 (86.67) | 85.2 | ||
| Variant ALL | pro ВІ | 8 | 2 (25.00) | 6 (75.00) | 50.0 | 0.94896 |
| Common BII | 75 | 11 (14.67) | 64 (85.33) | 79.4 | ||
| Pre ВІІІ | 6 | 2 (33.33) | 4 (66.67) | 66.7 | ||
| Т | 16 | 3 (18.75) | 13 (81.25) | 81.3 | ||
| Variant ALL, depending on the coexpression of markers | ALL without coexpressions | 78 | 14 (17.95) | 64 (82.05) | 79.4 | 0.2700 |
| ALL+CD13+ | 15 | 1 (6.67) | 14 (93.33) | 90.0*** | ||
| ALL+CD33+ | 2 | 1 (50.0) | 1 (50.0) | 50.0 | ||
| ALL+CD13+. CD33+ | 4 | 1 (25.0) | 3 (75.0) | 0.0**** | ||
| В+Т ALL | 6 | 1 (16.67) | 5 (83.33) | 81.8 | ||
| В pure | 64 | 11 (17.18) | 53 (82.81) | 79.6 | 0.88915 | |
| В+Мy | 19 | 3 (15.78) | 16 (84.22) | 61.5 | ||
| В+Т | 6 | 1 (16.67) | 5 (83.33) | 81.8 | ||
| Т/Т+Му | 16 | 3 (18.72) | 13 (81.25) | 81.3 | ||
| Blasts, G/l before treatment | < 10.0 | 40 | 8 (20.0) | 32 (80.0) | 70.2 | 0.26312 |
| ≥ 10.0 | 65 | 10 (15.38) | 55 (84.62) | 73.8 | ||
| Bone narrow Blasts, % before treatment | < 90.0 | 55 | 10 (18.18) | 45 (81.82) | 69.4 | 0.69272 |
| ≥ 90 < 100.0 | 41 | 7 (17.07) | 34(82.93) | 75.9 | ||
| 100.0 | 9 | 1 (11.11) | 8 (88.89) | 71.4 | ||
| Blood leukocytes, G/l before treatment | < 4.0 | 24 | 3 (12.50) | 21 (87.50) | 72.9 | 0.58387 |
| ≥ 4.0 < 10.0 | 17 | 4 (2.53) | 13 (76.47) | 67.9 | ||
| ≥ 10.0 < 50.0 | 56 | 9 (16.07) | 47 (82.93) | 80.8 | ||
| ≥ 50.0 | 8 | 2 (25.00) | 6 (75.00) | 49.1 | ||
| Blood leukocytes, G/l 8th day treatment (n=) ***** | < 10.0 | 88 | 17 (19.32) | 71 (81.68) | 72.1 | 0.08907 |
| ≥ 10.0 | 17 | 1 (5.88) | 16 (94.12) | 50.0 | ||
| Blasts, G/l 8th day treatment | < 1.0 | 89 | 15. (16.85) | 74 (83.15) | 71.6 | 0.50839 |
| ≥ 1.0 | 16 | 3 (18.75) | 13 (81.25) | 79.5 | ||
| Blood leukocytes, G/l 15th day treatment | <1.5 | 29 | 6 (20.69) | 23 (79.31) | 65.4 | 0.66140 |
| ≥1.5 | 76 | 12 (15.79) | 64 (84.21) | 76.1 | ||
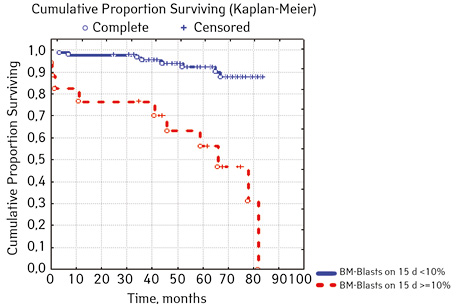
| Bone narrow Blasts 15th day treatment,% | < 10.0 | 88 | 8 (9.09) | 80 (90.90) | 87.6 | 0.00002 |
| ≥ 10.0 | 17 | 10 (58.82) | 7 (41.18) | 15.0 | ||
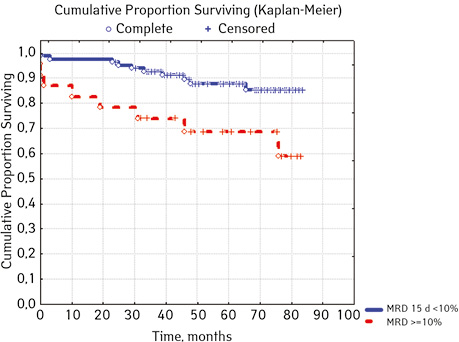
| MRD in the bone marrow on day 15, % | < 10.0 | 82 | 10 (12.05) | 72 (87.80) | 84.5 | 0.01076 |
| ≥ 10.0 | 23 | 8(36.36) | 15 (65.22) | 53.3 | ||
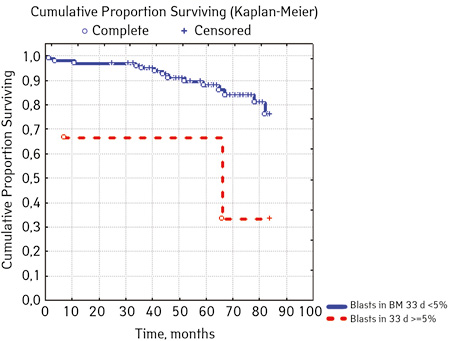
| Bone narrow Blasts on day 33, %***** | <5.0 | 100 | 14 (14.00) | 86 (86.00) | 74.4 | 0.02327 |
| ≥5.0 | 2 | 2 (66.67) | 1 (33.33) | 33.3 | ||
| MRD in the bone marrow on day 33, % ***** | < 0.01 | 91 | 8 (8.79) | 83 (91.21) | 86.3 | 0.00000 |
| ≥0.01 | 12 | 8 (66.67) | 4 (33.33) | 28.9 | ||
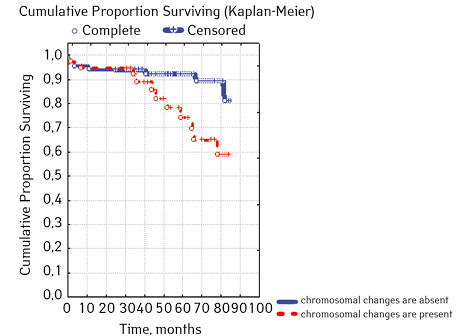
| Molecular genetic changes | Not found | 66 | 7 (10.61) | 59 (89.39) | 82.7 | 0.06842 |
| Detected | 39 | 11 (28.21) | 28 (71.79) | 57.3 | ||
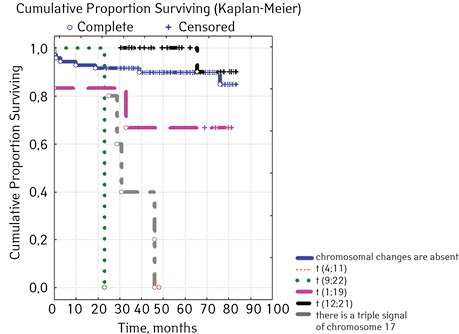
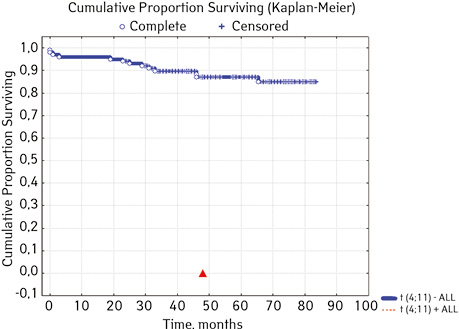
| t(4;11)(q23;p23)AF4/MLL
(n=100) ****** |
Not found | 99 | 13 (13.13) | 86 (86.87) | 84.6 | 0.02914 |
| Detected | 1 | 1 (100) | 0 (0.0) | 0 | ||
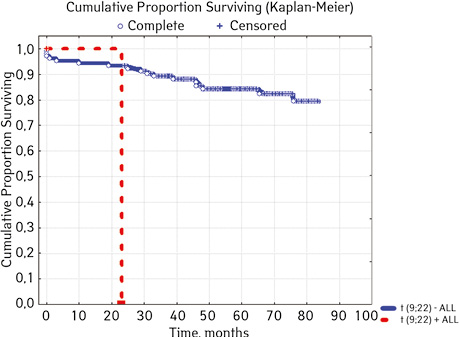
| t(9;22)(q34;q11) BCR/ABL | Not found | 103 | 17 (16.50) | 86 (83.50) | 77.6 | 0.00589 |
| Detected | 2 | 1 (50.00) | 1 (50.00) | 0 | ||
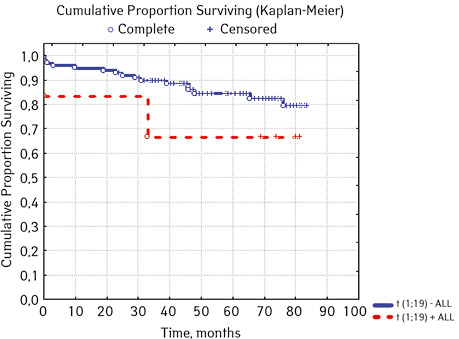
| t(1;19)(q23;p13) E2A/PBX1 | Not found | 99 | 16 (16.16) | 83 (83.84) | 77.3 | 0.20000 |
| Detected | 6 | 2 (33.33) | 4 (66.67) | 66.7 | ||
| t(12;21)(q13;q22) TEL/AML
(n=102) ****** |
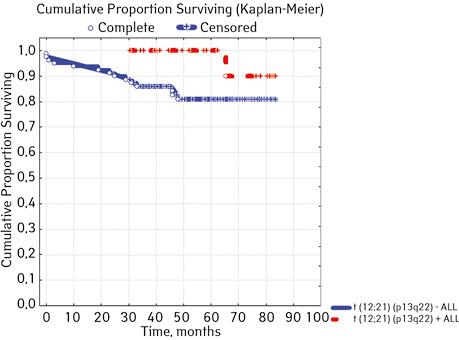
Not found | 80 | 14 (17.50 | 66 (82.50 | 80.9 | 0.02455 |
| Detected | 22 | 1 (4.55) | 21 (95.45) | 90.0 | ||
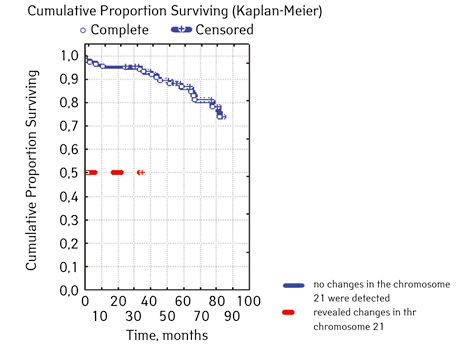
| triple signal on chromosome 17 | Absence | 100 | 13 (13.00) | 87 (87.00) | 81.3 | 0.00000 |
| Availability | 5 | 5 (100.00) | 0 | 0 | ||
Note: *Cox F-test; **p=0.00137 significant compared with HLG; ***p=0.04314 significant compared with ALL+ CD13+ between ALL+ CD33+; *****p=0.05532 comparatively between three groups ALL+ CD13+ between ALL+ CD33+ and ALL+ CD13+. CD33+; *****Two patients died before the 33rd day of treatment; ******Not all patients were examined.
According to the studies of Moericke et al., Therapies for ALL over the past decade have ensured event-free survival in 79–86% of cases [1]. A positive prognosis and high efficiency of treatment were observed in the age group from 1 to 10 years. Accordingly, in the group of the first year of life and children over 10 years of age, the course of ALL had a worse prognosis and was worse undergoing therapy [2]: the 5-year event-free survival rate of patients under 1 year was 47–54% [3].
Molecular and cytogenetic markers are independent factors in predicting the course of ALL, both in adults and in children. That is why these pre-closeness are one of the obligatory, first of all, in ALL [4]. As a result, hyperploidy was found in about a third (25–30%) of children with B-GL [5], while in adults this phenomenon is diagnosed only in 2–10% of cases [6, 7]. In this case, in the nucleus of leukemic cells instead of the normal 46 chromosomes 51–67.
It is worth saying that hyperploidy in ALL is one of the factors indicating a favorable course: almost all patients achieve complete remission, and the event-free 5-year survival rate is 71–83%, the event-free 5-year overall survival rate is 90%. In addition, hyperploidy is more characteristic of B-GL, since such a picture is very rare in T-GL [8].
The most effective treatment was found in children with additional 4, 10, 17 chromosomes [9], as well as 4, 18 chromosomes [10].
In addition, the translocation t (12; 21) (p13; q22), which is observed in 25% of children with pre-B-GL, is considered a favorable factor. Due to this, the oncogene ETV6-RUNX1 (TEL-AML1) is formed. The FISH method is used to detect this rearrangement, and the reverse transcriptase polymerase chain reaction is used to identify the strange oncogene [11]. In 94% of cases of detection of such a rearrangement, a quick response to treatment and relatively early remission are achieved.
Along with this, translocation in 75% of patients is diagnosed with other genetic changes. Among them, the most common deletion is 12 L. This causes the loss of non-linked by translocation by translocation t (12; 21) copies of the ETV6 (55–70% of cases), +21 (15–20% of cases) and + der (21) t (12; 21) (10–15% of cases). With del (12p), the threshold worsens. At the same time, the presence of + der (21) t (12; 21) is associated with a worse response to therapy, compared with the results of patients with del (12p) and + 21 [12].
For the correct selection of therapy, it is critical to search for the MLL gene, since any rearrangement of it entails a significant deterioration in the prognosis. During diagnostics, a wide variability of changes was found in the 11q23 region [13].
It should be said that in routine diagnostics, only the fancy MLL-AF4 gene is determined, which accounts for about half of the changes in the MLL gene. In this regard, a detailed search for abnormal rearrangements of the MLL gene should be carried out when detecting NG2 expression in tumor cells. This is especially important for children and the prognosis of the course of their illness. Diagnostics in this case is carried out by long inverted PCR, multiplex reverse transcriptase-PCR, also FISH, and not just by standard definition.
According to domestic data, according to a study by A. Dorosh et al., From February 1993 to March 2018, 370 cardiac patients treated for ALL for immunophenotypic ALL variants in the vast majority (82.13%) were diagnosed with B-cell ALL, respectively, only in In 14.42% of cases, THLL was detected and in 3.45% of cases — coexpression on leukemic blasts T, B-cell and myeloid antigens [28,34,37,42,43,45,50,59,60], ie leukemia from osnakama of a mixed or hybrid phenotype (mixedphenotype acute leukemia), where b + T + MuHLL was shown in 7/11, and T + b + MuHLL — in 4/11.
According to B-lines, in the majority of patients with ALL were with common (BII) — 88, 55%, a preview (VII) was found only in 4.58% of cases. The expression of only B-cell antigens was diagnosed in 74.05% of cases. In 3.44% of cases, asynchronous T-cell markers of B-blasts were identified. Aberrant expression of one or two myeloid antigens in B-Lymphoblasts was confirmed in 59 patients.
Analyzing the results of studies of patients with T-linear ALL, a variant without expression of antigens of other lines was found in 86.96% of cases, while myeloid markers on T-blasts were diagnosed in 13.04% [14, 15].
CONCLUSIONS
After analyzing individual clinical and laboratory parameters of ALL patients who received cytostatic therapy ALLIC BFM 2009, we evaluated their prognostic value.
In 79% of patients, no adverse events (AD) were observed during the entire follow-up period. Patients at greatest risk of AD occur between months 19 and 48 of follow-up. There was no significant difference between the sexes of the studied cases (p=0.610). There was no significant difference in the occurrence of events in patients of different ages (p=0.890). The risk of AD in the HLG subgroup is significantly higher than in the HGD subgroup (p=0.001). The time of the greatest number of events in these subgroups did not differ and fit into the general trend. There was no dependence on the number of leukocytes on the 8th day (p=0.089). The risk of AD almost from the beginning of follow-up is high in patients with the number of BM blasts on day 15 ≥10% (p<0.001). They also show a uniform increase in the risk of events throughout the observation period, while in patients with the number of BM blasts on day 15 <10%, it increases from 34 to 68 months of observation. The risk of AD is higher almost from the beginning of follow-up in patients with MRD in bone marrow at 15 days ≥10% and increases throughout the entire period of observation, whereas in patients with MRD in bone marrow at 15 days ≥10% is highest from 23 to 65 month (p=0.011). The risk of AD is higher in patients with BM blasts at day 30 ≥5% (p=0.023). Although you can take this result into account, so how was the number of patients in this subgroup not sufficient (n=2)? No dependence on ALL variant was found (p=0.945). There was no significant difference in subgroups depending on the coexpression of markers (p=0.270). In patients with translocation t (12; 21), the risk of negative events is significantly lower (p=0.025). Other chromosomal translocations cannot be characterized due to the small number of individuals in whom they were found.
REFERENCES
1. Möricke, A., Reiter, A., Zimmermann, M., Gadner, H., Stanulla, M., Dördelmann M., … Schrappe M. (2008). Risk-adjusted therapy of acute lymphoblastic leukemia can decrease treatment burden and improve survival: treatment results of 2169 unselected pediatric and adolescent patients enrolled in the trial ALL-BFM 95. Blood,111(9), 4477–4489. doi: 10.1182/blood-2007-09-112920.
2. Malbora, B., Avci, Z., Alioglu, B., Tutar, N. U., & Ozbek, N. (2008). A case with mature B-cell acute lymphoblastic leukemia and pancreatic involvement at the time of diagnosis. Journal of pediatric hematology/oncology, 30(1), 87–89. doi: 10.1097/MPH.0b013e31815cc3fe.
3. Pieters R., Schrappe M., De Lorenzo P., Hann I., De Rossi G., Felice M., … Valsecchi M. G. (2007). A treatment protocol for infants younger than 1 year with acute lymphoblastic leukaemia (Interfant-99): an observational study and a multicentre randomised trial. The Lancet, 370(9583), 240–250. doi: 10.1016/S0140-6736(07)61126-X.
4. McGregor, S., McNeer, J. & Gurbuxani, S. (2012). Beyond the 2008 World Health Organization classification: the role of the hematopathology laboratory in the diagnosis and management of acute lymphoblastic leukemia. Seminars in diagnostic pathology, 29(1), 2–11. doi: 10.1053/j.semdp.2011.07.004.
5. Zerbini, M. C. N., Soares, F. A., Velloso, E. D. R. P., Chaufaille, M. D. L. L., & Paes, R. P. (2011). World Health Organization Classification of tumors of hematopoietic and lymphoid tissues, 4th edition, 2008 — major changes from the 3rd edition, 2001. Revista da Associação Médica Brasileira, 57(1), 6–73.
6. Paulsson, K., & Johansson, B. (2009). High hyperdiploid childhood acute lymphoblastic leukemia. Genes, Chromosomes and Cancer, 48(8), 637–660. doi: 10.1002/gcc.20671.
7. Mrózek, K., Harper, D. P., & Aplan, P. D. (2009). Cytogenetics and molecular genetics of acute lymphoblastic leukemia. Hematology/Oncology Clinics, 23(5), 991–1010. doi: 10.1016/j.hoc.2009.07.001.
8. Heerema NA, Raimondi SC, Anderson JR, Biegel J, Camitta BM, Cooley LD, … Carroll A. J. (2007). Specific extra chromosomes occur in a modal number dependent pattern in pediatric acute lymphoblastic leukemia. Genes, Chromosomes and Cancer, 46(7), 684–693. doi: 10.1002/gcc.20451.
9. Woo, J. S., Alberti, M. O., & Tirado, C. A. (2014). Childhood B-acute lymphoblastic leukemia: a genetic update. Experimental hematology & oncology, 3(1), 1–14. doi: 10.1186/2162-3619-3-16..
10. Sutcliffe M. J., Shuster J. J., Sather H. N., Camitta B. M., Pullen J., Schultz K. R., … Heerema N. A. (2005). High concordance from independent studies by the Children’s Cancer Group (CCG) and Pediatric Oncology Group (POG) associating favorable prognosis with combined trisomies 4, 10, and 17 in children with NCI Standard-Risk B-precursor Acute Lymphoblastic Leukemia: a Children’s Oncology Group (COG) initiative. Leukemia, 19(5), 734–740. doi: 10.1038/sj.leu.2403673.
11. Moorman A. V., Richards S. M., Martineau M., Cheung K. L., Robinson H. M., Jalali G. R., … Harrison C. J. (2003). Outcome heterogeneity in childhood high-hyperdiploid acute lymphoblastic leukemia. Blood, 102(8), 2756–2762. doi: 10.1182/blood-2003-04-1128.
12. Oostlander, A. E., Meijer, G. A., & Ylstra, B. (2004). Microarray‐based comparative genomic hybridization and its applications in human genetics. Clinical genetics, 66(6), 488–495. doi: 10.1111/j.1399-0004.2004.00322.x.
13. Rubnitz J. E., Wichlan D., Devidas M., Shuster J., Linda S. B., Kurtzberg J., … Pullen J. (2008). Prospective analysis of TEL gene rearrangements in childhood acute lymphoblastic leukemia: a Children’s Oncology Group study. Journal of clinical oncology, 26(13), 2186–2191. doi: 10.1200/JCO.2007.14.3552.
14. Meyer, C., Kowarz, E., Hofmann, J., Renneville, A., Zuna, J., Trka J, … Marschalek R. (2009). New insights to the MLL recombinome of acute leukemias. Leukemia, 23(8), 1490–1499. doi: 10.1038/leu.2009.33.
15. Dorosh, O. I., Tsymbalyuk-Voloshin, I. P., Bodak, Kh. I., Polishchuk, R. S., Stepanyuk, A. I., Hlynskа O. (2018). Progress in the treatment of acute lymphoblastic leukemia: 25 years of application of international protocols in the Department of Pediatric Hematology of the Western Ukrainian Specialized Pediatric Medical Center. Modern Pediatrics, 8, 22–36 (In Ukrainian). doi: 10.15574/SP.2018.96.22.
Прогнозирование отдельных клинических и лабораторных показателей лимфобластной лейкемии у детей, получивших цитостатическую терапию ALLIC BFM 2009
Львовский национальный медицинский университет имени Данила Галицкого, Львов
Резюме. Цель. Исследовать прогностическое значение отдельных клинических и лабораторных показателей острого лимфобластного лейкоза у детей, получавших цитостатическую терапию ALLIC BFM 2009. Методы. Анализ клинической картины пациентов на основе лабораторных исследований (общий анализ крови и мочи, цитологические исследования, биохимический анализ крови, проточная цитометрия с использованием моноклональных антител), статистический анализ. Результаты. Проанализированы индивидуальные клинические и лабораторные показатели пациентов, получавших цитостатическую терапию ALLIC BFM 2009 с оценкой их прогностического значения. Выводы. Обобщенный анализ прогностических факторов при использовании протокола ALLIC-BFM 2009 для лечения детей с острым лимфобластным лейкозом является важным для улучшения результатов их терапии.
Ключевые слова: острый лимфобластный лейкоз; оценка выживаемости; прогнозирования; терапия.
Correspondence:
Olena Vynnytska
69 Pekarska Str, Lviv 79010
Danylo Halytsky Lviv National Medical University
E-mail: E-mail: ovinnitska@gmail.com
Адреса:
Вінницька Олена
79010, Львів, вул. Пекарська, 69
Львівський національний медичний університет
імені Данила Галицького
E-mail: ovinnitska@gmail.com


Leave a comment