





Deep learning-based breast cancer detection on mammography in Uzbekistan: a multicentre retrospective study
Tokhtamuratov U. , Adilkhodjaev A. , Ibragimov I., Kurbanova S. , Kasparova G. , Seytmuratova A. , Ososkov A.
Summary. Uzbekistan has mandated hybrid artificial intelligence (AI) and radiologist reading of screening mammograms, but no AI system has been clinically evaluated in its population. The aim of the study was to assess the diagnostic performance of a deep learning model for breast cancer detection on mammograms from Uzbekistan and to compare it with the primary radiologist. Object and methods. Retrospective multicentre diagnostic accuracy study of 1,759 anonymised full-field digital mammography examinations with a verified outcome, selected from 33,599 examinations performed from March 2022 to April 2023 in Tashkent, Nukus and Samarkand. A YOLO11-based detection model was trained only on public datasets (Radiological Society of North America (RSNA) and VinDr-Mammo); the Uzbek data were used solely for testing. The reference standard was histopathology, clinical confirmation or 6–24-month imaging follow-up. The comparator was the primary radiologist’s Breast Imaging Reporting and Data System (BI-RADS) 4–5 assessment (biopsy recommendation); alternative handling of incomplete (BI-RADS 0) assessments was tested in sensitivity analyses. ROC analysis, bootstrap confidence intervals (CI), McNemar’s test and multivariable logistic regression were used. Results. Breast cancer was confirmed in 316 women (18.0%). The model achieved an area under the curve (AUC) of 0.914 (95% confidence interval — CI 0.895–0.932); at the Youden threshold (0.495) sensitivity was 0.829 and specificity 0.852, versus 0.968 and 0.836 for the radiologist. Overall accuracy did not differ significantly (McNemar p=0.31), but the radiologist was more sensitive (p <0.001). When the 70 BI-RADS 0 examinations (4 cancers, all scored above the AI threshold) were counted as positive, the radiologist’s specificity fell to 0.791, the AI became significantly more specific (p <0.001) and overall accuracy still did not differ (p=0.07). All 5 interval cancers missed by the radiologist (BI-RADS 1–2) received AI scores above the threshold. Family history, hormone therapy, age, body mass index (BMI), previous biopsy and breast density were independent predictors of cancer. Conclusions. A deep learning model trained on public data showed high discriminative ability on Uzbek mammograms, with overall accuracy comparable to the radiologist but lower sensitivity; it is best suited to the role of a second reader within the national hybrid reading workflow, and prospective validation is required.
DOI: 10.32471/clinicaloncology.2663-466X.36794
Received 30.09.2026
Accepted 13.10.2026
INTRODUCTION
Breast cancer is the most frequently diagnosed malignancy in women worldwide, with about 2.3 million new cases and 670,000 deaths in 2022, and its burden is projected to keep rising, particularly in low- and middle-income countries [1, 2]. The World Health Organization Global Breast Cancer Initiative calls for earlier diagnosis as the first pillar of breast cancer control [3]. Population mammography screening reduces breast cancer mortality [4], but its interpretation is subjective, and a substantial share of cancers is missed at single reading, particularly in dense breasts [5]. European guidelines therefore recommend double reading [6], which doubles the demand for trained radiologists — a resource that is scarce in many countries of Central Asia.
Deep learning systems of AI have reached radiologist-level accuracy in retrospective studies [7–9]. In the randomised Mammography Screening with Artificial Intelligence (MASAI) trial, AI-supported screening increased cancer detection while reducing screen-reading workload by 44%, without increasing interval cancers [10, 11], and the nationwide PRAIM implementation in Germany confirmed higher detection rates in routine practice [12]. AI-integrated reading has also been shown to be a feasible replacement for double reading [13]. However, the performance of AI can drop substantially on external data [14], almost all evidence comes from high-income European, North American and East Asian populations, and implementation barriers in other settings remain poorly studied [9, 15].
Uzbekistan has adopted a national strategy for AI [16] and, by Presidential Resolution PP-402 of 22 November 2024, a programme for the early detection of breast and cervical cancer that provides for hybrid AI–radiologist reading of screening mammograms at a unified reading centre [17]. To our knowledge, no AI mammography system has yet been evaluated on the population of Uzbekistan.
AIM
To assess the diagnostic performance of a deep learning model for breast cancer detection on mammograms obtained at 3 regional centres in Uzbekistan, to compare it with the assessment of the primary radiologist, and to identify clinical factors associated with breast cancer in this cohort.
MATERIALS AND METHODS
Study design and ethics. This was a retrospective multicentre diagnostic accuracy study reported according to the Checklist for Artificial Intelligence in Medical Imaging (CLAIM) 2024 [18]; the completed checklist is provided as Supplementary File 1. It was approved by the Institutional Review Board of the Republican Specialized Scientific and Practical Medical Center of Oncology and Radiology (protocol № 2.4.2, 24 February 2024); informed consent was waived because only fully anonymised data were used. The study complied with the Declaration of Helsinki.
Study population. Between March 2022 and April 2023, 33,599 full-field digital mammography examinations were performed for screening or diagnostic indications at 3 regional centres. Of these, 31,840 (94.8%) were excluded because neither imaging follow-up nor histology was available, and 1,759 examinations of women aged 35–80 years with a verified outcome were included: Tashkent (n=899), Nukus (n=557) and Samarkand (n=303) (Fig. 1). All eligible examinations with a reference standard were included, so no formal sample size calculation was performed; with 316 cancers the expected half-width of the 95% CI for sensitivity was about ±4 percentage points. Every examination was reported by one of 12 primary radiologists using the Breast Imaging Reporting and Data System (BI-RADS) of the American College of Radiology (ACR) [19]; 768 examinations (43.7%) were independently double read by 1 of 3 second readers, with disagreements resolved by a senior radiologist. Age, BMI, ACR breast density category (A–D), menopausal status, family history of breast cancer, previous breast biopsy and hormone therapy were recorded from the clinical records.
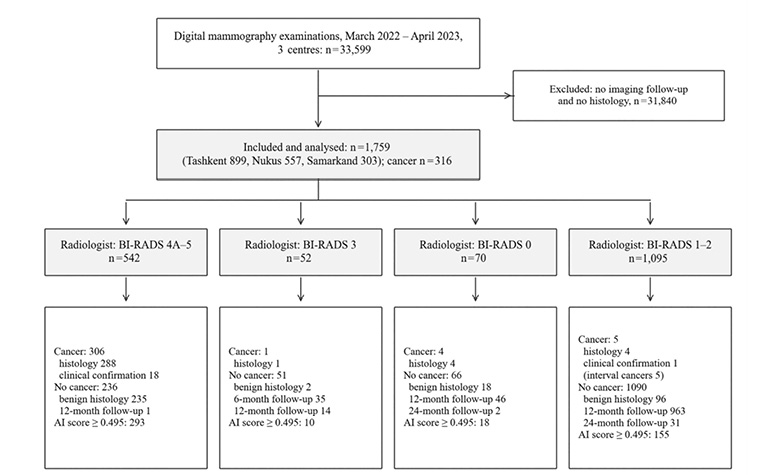
Fig. 1. Flow of examinations by the primary radiologist’s BI-RADS assessment and the reference standard, with the number of examinations scored above the AI threshold in each group
Image acquisition and quality control. All examinations were acquired at the 3 centres on Fujifilm AMULET Sophinity full-field digital mammography systems (Fujifilm, Tokyo, Japan) with an amorphous-selenium direct-conversion detector and a 50-µm pixel size, as craniocaudal and mediolateral oblique views of each breast (2-dimensional mammography only; digital breast tomosynthesis was not used). Positioning and image quality were checked by the reporting radiologists according to the centres’ standard protocol; images with inadequate positioning or artefacts were repeated before reporting (technical repeats: n=61; 3.5%). The images were exported from the picture archiving and communication system in DICOM (Digital Imaging and Communications in Medicine) format and anonymised before analysis.
Reference standard. Cancer status was established by histopathology (297 malignant and 351 benign results), by clinical confirmation of malignancy (n=19), or, for women without a biopsy, by imaging follow-up. A woman was classified as cancer-free when the follow-up mammogram was assessed as BI-RADS 1–2 (or as a stable BI-RADS 3 finding) and no breast cancer had been recorded in the medical records of the participating centres by April 2026, the date of the last record review, i.e. at least 36 months after every index examination. Imaging follow-up was performed at 12 months (n=1024), 24 months (n=33) or 6 months (n=35). All 35 examinations with only 6-month follow-up were BI-RADS 3 findings under the short-interval surveillance recommended by BI-RADS [19]; because this interval is shorter than the time to diagnosis of some interval cancers, their exclusion was tested in a sensitivity analysis. BI-RADS 0 examinations received their outcome from the subsequent work-up (additional imaging, biopsy or follow-up) according to the same criteria. An interval cancer was defined as a cancer diagnosed after an initial negative (BI-RADS 1–2) assessment.
AI model. The model is owned by Uzinfocom, a state-owned company, and was developed within the national programme established by Presidential Resolution PP-402 [17], exclusively on public data (Table 1); the technical details are given in Supplementary File 2 and the development pipeline in Supplementary Fig. S1. It is based on the YOLO11 (You Only Look Once, version 11) single-stage object detector [20] in its large configuration (YOLO11l; about 25 million parameters), which consists of a convolutional backbone with C3k2 and spatial pyramid pooling blocks and a C2PSA attention module, a feature-pyramid neck and an anchor-free detection head. The weights were initialised from Ultralytics checkpoints pretrained on the COCO (Common Objects in Context) dataset (transfer learning). The training targets were the 2 lesion classes annotated with bounding boxes in the VinDr-Mammo dataset [21], mass and calcification (1,107 images). These annotations define what the detector was trained to localise; they do not show which image features drive its malignancy score, which was not examined with interpretability methods. DICOM images were converted to 8-bit PNG using the DICOM window settings and tiled into 1,024×1,024-pixel patches with 30% overlap; training used the framework’s default composite loss (binary cross-entropy for classification, complete intersection-over-union and distribution focal loss for box regression) and its default hyperparameters and augmentation (mosaic, flips, scaling, colour jitter). In a second stage, the initial model was applied to mass cases from the Radiological Society of North America (RSNA) Screening Mammography Breast Cancer Detection dataset [22]; its 2,659 candidate detections were reviewed by 2 experienced radiologists, and only confirmed lesions were added to the training set of the final model. The checkpoint with the best detection performance on a randomly selected, held-out validation subset of the VinDr-Mammo images was selected, and a single model (no ensembling) was used. At inference, each of the 4 views was tiled in the same way, detections from overlapping tiles were merged by non-maximum suppression, and the examination score (0–1) was the highest detection confidence across the 4 views. The model was frozen before testing: the Uzbek examinations were not used for training, fine-tuning or calibration. The training logs (number of epochs, learning-rate schedule, internal validation metrics) were not retained.
| Dataset | Country, years | Size | Annotation | Role |
|---|---|---|---|---|
| VinDr-Mammo | Vietnam, 2018–2019 | 5,000 examinations (1,107 images with mass or calcification used) | Bounding boxes, BI-RADS | Stage 1 training: mass and calcification detection |
| RSNA Screening Mammography | USA, 2016–2022 | 54,706 examinations (mass cases used) | Examination level; 2,659 detections verified by 2 radiologists | Stage 2: radiologist-verified lesions added to training |
| Present study | Uzbekistan, 2022–2023 | 1,759 examinations | Examination level, BI-RADS | Clinical test set only |
Radiologist comparator. The comparator was the primary radiologist’s BI-RADS assessment at the index reading, before any further work-up. In the primary analysis it was dichotomised at the recommendation of tissue diagnosis: positive for BI-RADS 4A, 4B, 4C or 5 and negative for BI-RADS 1, 2 and 3. The comparator therefore represents a biopsy decision rather than a screening recall decision. BI-RADS 0 denotes an incomplete assessment that requires further evaluation [19]; in the primary analysis the 70 BI-RADS 0 examinations were counted as negative because no biopsy was recommended at the index reading, while their outcome labels came from the subsequent work-up, similar to the approach of assigning outcomes only after diagnostic evaluation [23]. Because this choice affects the paired comparison, 3 alternative definitions were analysed: BI-RADS 0 classified as positive (recall decision), as in screening AI studies [24, 25]; BI-RADS 0 and 3 classified as positive (any non-routine recommendation); and BI-RADS 0 examinations excluded as indeterminate [26].
Data processing. Continuous variables are presented as mean ± standard deviation (SD) and compared with Student’s t-test; categorical variables are presented as absolute numbers and percentages and compared with the χ² test. Discrimination was assessed with the area under the receiver operating characteristic (ROC) curve (AUC). The operating threshold was chosen by maximising Youden’s index [27]. Sensitivity, specificity, positive and negative predictive values (PPV, NPV), F1-score and accuracy were calculated with 95% CI from 2,000 nonparametric bootstrap resamples. Paired comparison of AI and radiologist was performed with McNemar’s test (with continuity correction for overall accuracy; exact test for sensitivity and specificity). With the AI threshold fixed, the paired comparison was repeated under the alternative BI-RADS 0 definitions, after excluding examinations verified only by 6-month follow-up, and in histologically verified examinations. To estimate the effect of cancers that imaging follow-up may have missed, the interval-cancer rate observed among BI-RADS 1–2 examinations was applied to all follow-up-verified examinations, and sensitivity was recalculated under best- and worst-case assumptions for the AI. Factors associated with breast cancer were analysed by multivariable logistic regression including age, BMI, breast density, family history, previous biopsy and hormone therapy; results are given as adjusted odds ratios (aOR) with 95% CI; examinations without recorded density were excluded from this model (complete-case analysis). 2-sided p <0.05 was considered significant. Statistical analyses were performed in Python 3.13 (pandas, NumPy, SciPy, scikit-learn, statsmodels, Matplotlib); the model was trained and run with PyTorch and the Ultralytics library.
Use of AI. In the process of preparing this article, the authors used ChatGPT (OpenAI) for language editing, translation of the summary into Ukrainian and formatting of references. After using the specified tool, the authors independently checked and edited the text and bear full responsibility for the content of the publication. The AI model evaluated in this study is the object of the research and is described above.
RESULTS
Of 1,759 women (mean age 54.5±7.6 years), breast cancer was confirmed in 316 (18.0%). Women with cancer were older, had a higher BMI, and more often were postmenopausal, reported a family history of breast cancer, a previous biopsy or hormone therapy (Table 2). Cancer prevalence was 17.2% in Tashkent, 19.7% in Nukus and 16.8% in Samarkand; technical repeat rates were 3.3; 3.1 and 4.6%, respectively. The mean interval from mammography to biopsy was 8.2±3.8 days.
| Characteristic | Category | Total | No cancer (n=1,443) | Cancer (n=316) | p |
|---|---|---|---|---|---|
| Age, years (mean ± SD) | 54.5±7.6 | 53.6±7.7 | 58.5±5.7 | <0.001 | |
| BMI, kg/m² (mean ± SD) | 29.6±4.3 | 29.3±4.4 | 31.1±3.4 | <0.001 | |
| Breast density (ACR), n (%) | A | 168 (9.6) | 151 (10.5) | 17 (5.4) | 0.015 |
| B | 738 (42.0) | 601 (41.6) | 137 (43.4) | ||
| C | 638 (36.3) | 522 (36.2) | 116 (36.7) | ||
| D | 196 (11.1) | 151 (10.5) | 45 (14.2) | ||
| Not recorded | 19 (1.1) | 18 (1.2) | 1 (0.3) | ||
| Postmenopausal, n (%) | 1217 (69.2) | 942 (65.3) | 275 (87.0) | <0.001 | |
| Family history of breast cancer, n (%) | 151 (8.6) | 54 (3.7) | 97 (30.7) | <0.001 | |
| Previous breast biopsy, n (%) | 40 (2.3) | 24 (1.7) | 16 (5.1) | <0.001 | |
| Hormone therapy, n (%) | 178 (10.1) | 55 (3.8) | 123 (38.9) | <0.001 | |
| BI-RADS 4A–5, n (%) | 542 (30.8) | 236 (16.4) | 306 (96.8) | <0.001 |
Note: The p-value for breast density refers to categories A–D.
At the Youden threshold of 0.495 the AI model correctly classified 262 of 316 cancers and 1,229 of 1,443 cancer-free examinations (Table 3); the ROC curve is shown in Fig. 2. AI scores were highest in BI-RADS 4C and 5 examinations, whereas in BI-RADS 4A and 4B the median score was below the threshold (Fig. 3).
| Metric | AI model, value (95% CI) | Radiologist BI-RADS ≥ 4, value (95% CI) |
|---|---|---|
| AUC | 0.914 (0.895–0.932) | — |
| Sensitivity | 0.829 (0.786–0.871) | 0.968 (0.948–0.987) |
| Specificity | 0.852 (0.833–0.871) | 0.836 (0.817–0.855) |
| PPV | 0.550 (0.505–0.595) | 0.565 (0.523–0.607) |
| NPV | 0.958 (0.946–0.969) | 0.992 (0.986–0.997) |
| F1-score | 0.662 (0.621–0.697) | 0.713 (0.679–0.746) |
| Accuracy | 0.848 (0.831–0.865) | 0.860 (0.844–0.875) |
| TP / FP / TN / FN | 262 / 214 / 1,229 / 54 | 306 / 236 / 1,207 / 10 |
Note: TP, FP, TN, FN — true positive, false positive, true negative, false negative. AI threshold 0.495 (Youden’s index).
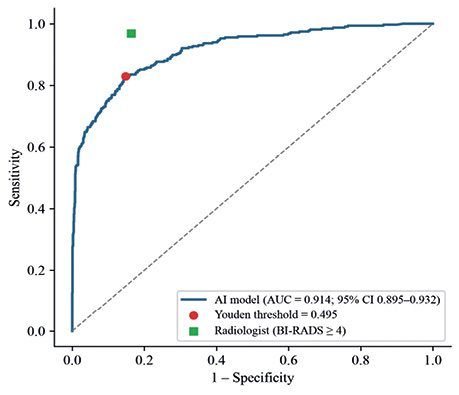
Fig. 2. ROC curve of the AI model on the Uzbek test set. The circle marks the Youden threshold; the square marks the primary radiologist (BI-RADS ≥4)
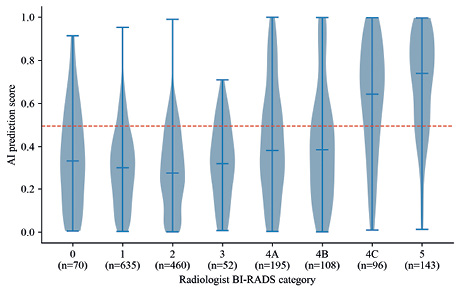
Fig. 3. Distribution of AI scores by the radiologist’s BI-RADS category. Horizontal bars show the median and range; the dashed line is the operating threshold (0.495)
Compared with the radiologist, the AI model detected 44 fewer cancers (262 vs 306 true positives) and produced 22 fewer false-positive results (214 vs 236). The 2 readers were both correct in 1,286 examinations and both wrong in 41; the AI alone was correct in 205 and the radiologist alone in 227. The difference in overall accuracy was not significant (χ²=1.02; p=0.312), nor was the difference in specificity (p=0.274), whereas the radiologist’s sensitivity was significantly higher (p <0.001).
Five interval cancers were diagnosed 5–19 months (mean 12.8) after an initial BI-RADS 1 (n=3) or BI-RADS 2 (n=2) assessment, corresponding to 0.41% of 1,217 examinations read as negative (BI-RADS 0–3) by the radiologist. All 5 received AI scores above the threshold (range 0.500–0.989). Two further records flagged as interval events had benign histology and were not counted as cancers.
The 70 BI-RADS 0 examinations (4.0%) included 4 cancers, all confirmed histologically; 18 women had benign biopsy results and 48 were cancer-free at 12- or 24-month follow-up (Fig. 1). The AI model scored 18 of these examinations above the threshold, including all 4 cancers (scores 0.675–0.914) and 8 of the 18 with benign biopsy. When BI-RADS 0 was counted as positive (recall decision), the radiologist’s sensitivity rose to 0.981 and specificity fell to 0.791; the AI model remained less sensitive (p <0.001) but was more specific (p <0.001), and overall accuracy did not differ (p=0.071) (Table 4). When BI-RADS 0 and 3 were both counted as positive, the radiologist’s specificity fell to 0.755 and the overall accuracy of the AI model was higher (p <0.001). Excluding BI-RADS 0 examinations did not change the primary results.
| Analysis | Examinations (cancers) | AUC of AI | Sensitivity: AI; radiologist; p | Specificity: AI; radiologist; p | Accuracy, p |
|---|---|---|---|---|---|
| Primary: BI-RADS 4A–5 positive, 0–3 negative | 1,759 (316) | 0.914 | 0.829 (0.786–0.871) 0.968 (0.948–0.987) p <0.001 |
0.852 (0.833–0.871) 0.836 (0.817–0.855) p=0.274 |
p=0.312 |
| BI-RADS 0 counted as positive (recall) | 1,759 (316) | 0.914 | 0.829 (0.786–0.871) 0.981 (0.964–0.994) p <0.001 |
0.852 (0.833–0.871) 0.791 (0.770–0.811) p <0.001 |
p=0.071 |
| BI-RADS 0 and 3 counted as positive | 1,759 (316) | 0.914 | 0.829 (0.786–0.871) 0.984 (0.969–0.997) p <0.001 |
0.852 (0.833–0.871) 0.755 (0.734–0.778) p <0.001 |
p <0.001 |
| BI-RADS 0 excluded | 1,689 (312) | 0.914 | 0.827 (0.784–0.868) 0.981 (0.964–0.994) p <0.001 |
0.855 (0.835–0.873) 0.829 (0.809–0.848) p=0.063 |
p=0.589 |
| 6-month follow-up negatives excluded | 1,724 (316) | 0.914 | 0.829 (0.787–0.871) 0.968 (0.948–0.987) p <0.001 |
0.851 (0.832–0.869) 0.832 (0.812–0.851) p=0.190 |
p=0.411 |
| Histologically verified only | 648 (297) | 0.906 | 0.828 (0.784–0.870) 0.970 (0.949–0.987) p <0.001 |
0.829 (0.789–0.866) 0.330 (0.281–0.381) p <0.001 |
p <0.001 |
Note: values are point estimates with 95% CI (2,000 bootstrap resamples); the first line in each cell refers to the AI model (fixed threshold 0.495), the second to the radiologist; p — McNemar’s test (exact for sensitivity and specificity, with continuity correction for overall accuracy).
Excluding the 35 examinations verified only by 6-month follow-up left the results essentially unchanged (AUC 0.914; AI sensitivity 0.829 and specificity 0.851; radiologist 0.968 and 0.832). Among the 648 histologically verified examinations, the AUC of the AI model was 0.906 and its specificity 0.829, compared with 0.330 for the radiologist, because benign biopsies were performed mainly after a suspicious radiologist assessment. Applying the interval-cancer rate observed among BI-RADS 1–2 examinations (5/1,095; 0.46%) to the 1,092 follow-up-verified examinations suggests that about 5 cancers could have been missed by follow-up; including them would lower the radiologist’s sensitivity to 0.953 and place the AI model’s between 0.816 (all missed by AI) and 0.832 (all detected by AI).
AI performance by breast density is shown in Fig. 4. AUC ranged from 0.886 in density C to 0.935 in density B; sensitivity was lowest in density C (0.759) and highest in density B (0.891).
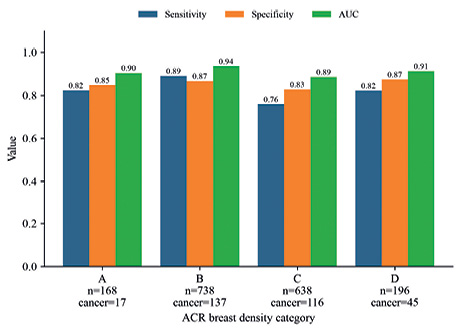
Fig. 4. Sensitivity, specificity and AUC of the AI model by ACR breast density category. Numbers of examinations and cancers are shown under each category
In multivariable analysis (n=1,740; 315 cancers; 19 examinations without recorded density excluded), all included factors were independently associated with breast cancer (Table 5, Fig. 5). The strongest associations were found for hormone therapy (aOR=15.66; 95% CI 10.54–23.27; p <0.001) and family history (aOR=13.31; 95% CI 8.66–20.46; p <0.001); the risk increased with breast density category. The model’s AUC was 0.858.
| Factor | aOR | 95% CI | p |
|---|---|---|---|
| Age (per year) | 1.08 | 1.06–1.11 | <0.001 |
| BMI (per kg/m²) | 1.11 | 1.06–1.15 | <0.001 |
| Family history | 13.31 | 8.66–20.46 | <0.001 |
| Previous biopsy | 4.07 | 1.86–8.89 | <0.001 |
| Hormone therapy | 15.66 | 10.54–23.27 | <0.001 |
| Breast density B (vs A) | 2.59 | 1.36–4.94 | 0.004 |
| Breast density C (vs A) | 3.24 | 1.68–6.24 | <0.001 |
| Breast density D (vs A) | 4.60 | 2.17–9.73 | <0.001 |
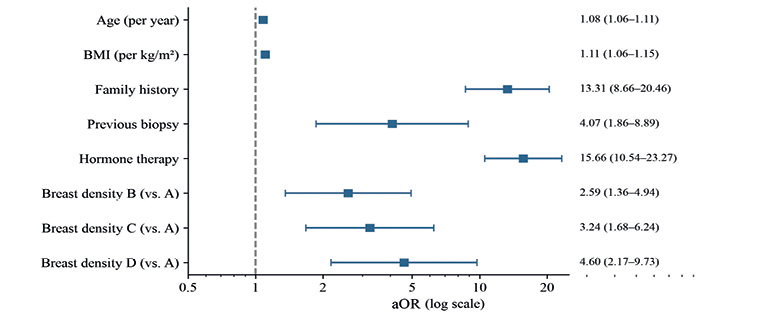
Fig. 5. Forest plot of aOR (logarithmic scale) with 95% confidence intervals from the multivariable logistic regression. The dashed line marks OR=1
DISCUSSION
In this first evaluation of an AI mammography system in Uzbekistan, a model trained exclusively on public foreign datasets reached an AUC of 0.914 on 1,759 examinations from 3 regional centres. This value lies within the range reported for commercial and academic systems in external validations [7–9] and suggests that the model transferred to a Central Asian population without local retraining — a relevant finding given the known performance drop of deep learning models on external data [14].
At the chosen threshold, the AI model had overall accuracy and specificity comparable to the primary radiologist, but significantly lower sensitivity (0.829 vs 0.968). The radiologist’s advantage should be interpreted with caution: the radiologist was not blinded to clinical information, diagnostic referrals were included, and the radiologist’s BI-RADS category partly determined which women underwent biopsy (partial verification), which favours the radiologist in the reference standard; this is illustrated by the radiologist’s specificity of only 0.330 among histologically verified examinations. Conversely, all 5 interval cancers missed by the radiologist received AI scores above the threshold. Together with the high NPV, this supports the use of AI as a second or concurrent reader rather than as a standalone replacement, in line with the MASAI and PRAIM experience [10–12] and with the hybrid reading model envisaged by Resolution PP-402 [13, 17].
The comparison also depends on what the radiologist’s decision is taken to mean. Our primary comparator was the biopsy recommendation (BI-RADS 4–5), whereas screening AI studies usually compare AI with the recall decision and count BI-RADS 0 as positive [24, 25], and others exclude incomplete assessments [26] or label them only after diagnostic work-up [23]. Under the recall definition, the radiologist became more sensitive (0.981) but less specific (0.791) than the AI model, and the overall accuracy of the two still did not differ; excluding BI-RADS 0 examinations did not change the primary results. All 4 cancers among BI-RADS 0 examinations were flagged by the AI model. The main conclusion — similar overall accuracy with a sensitivity–specificity trade-off that favours the radiologist’s sensitivity — is therefore robust to the handling of incomplete assessments.
Lower AI sensitivity in density C agrees with the known masking effect of dense tissue [5, 25], although the CI across density categories overlap. The association of breast density with cancer risk is consistent with international data [28]. The odds ratios for family history (13.3) and hormone therapy (15.7) are, however, much larger than population estimates, which are typically around 2 for a first-degree relative [29] and generally below 2.5 for current menopausal hormone therapy [30]. We attribute this mainly to the design of the cohort: the inclusion of diagnostic referrals, the restriction to examinations with a verified outcome, the high cancer prevalence (18.0% vs less than 1% in population screening [10]) and the likely more complete documentation of risk factors in women with suspicious findings. These estimates therefore describe associations in a referral cohort and should not be interpreted as population risk estimates.
The study has limitations. It was retrospective and single-country. Only 5.2% of the examinations performed in the study period had imaging follow-up or histology and could be included; this selection enriched the cohort with women who had suspicious findings, inflates PPV relative to a screening setting, and may make sensitivity and specificity differ from those in an unselected screening population (spectrum and verification bias). The operating threshold was selected on the same test set, which makes the reported sensitivity and specificity optimistic; AUC is not affected. All images came from one vendor (Fujifilm), so performance on other mammography systems remains to be tested. Double reading was performed in only 43.7% of examinations. Most cancer-free women were verified by 12-month imaging follow-up, which is shorter than the time to diagnosis of some interval cancers (up to 19 months); records were reviewed for at least 36 months, but cancers diagnosed outside the participating centres could have been missed, although our bias analysis suggests that the resulting misclassification is small. The training logs of the model were not retained, so its development cannot be reproduced in every detail, although the frozen model was applied unchanged to all test examinations. Lesion localisation was not evaluated because the Uzbek data contain no lesion-level annotations. Finally, only 3 regions were represented.
Prospects for further research include prospective validation of a pre-specified threshold in the unified mammography reading centre, extension to all regions of Uzbekistan and to other mammography vendors, evaluation of lesion-level localisation, and linkage with pathology and cancer registry data to assess interval cancers and cost-effectiveness [15].
CONCLUSIONS
1. A deep learning model trained only on public datasets showed high discriminative ability for breast cancer on mammograms from Uzbekistan (AUC 0.914; 95% CI 0.895–0.932).
2. The overall accuracy and specificity of the model were comparable to the primary radiologist, but its sensitivity was lower (0.829 vs 0.968); therefore, the model should be used as a second reader within a hybrid AI–radiologist workflow, not as a standalone reader.
3. The model assigned above-threshold scores to all interval cancers missed at the initial reading, which supports its potential to reduce false-negative screening results; this requires confirmation in a prospective study.
Funding. The study received no external funding.
Conflict of interest. The evaluated model is owned by Uzinfocom, a state-owned company, and was developed within the national programme established by Presidential Resolution PP-402. The study received no funding from Uzinfocom, and the authors have no financial or commercial interest in the model; they declare no conflict of interest.
Authors’ contributions. U. Tokhtamuratov and A. Adilkhodjaev — study concept; U. Tokhtamuratov — methodology, statistical analysis, writing of the manuscript; U. Tokhtamuratov and I. Ibragimov — software; A. Seytmuratova, A. Ososkov and A. Adilkhodjaev — validation; A. Seytmuratova, G. Kasparova and I. Ibragimov — data collection; I. Ibragimov and G. Kasparova — data curation; A. Adilkhodjaev and A. Ososkov — critical revision; A. Adilkhodjaev — supervision; S. Kurbanova — project administration. All authors approved the final version.
Data availability. The training datasets are publicly available (RSNA, VinDr-Mammo), and the YOLO11 framework is open-source software (AGPL-3.0 licence). The trained model weights belong to Uzinfocom and are not publicly available. The Uzbek clinical dataset is not public; anonymised data are available from the corresponding author on reasonable request, subject to approval by the Ministry of Health of the Republic of Uzbekistan.
Supplementary materials. Supplementary File 1 — completed CLAIM 2024 checklist; Supplementary File 2 — technical description of the AI model, including Supplementary Fig. S1 (model development pipeline).
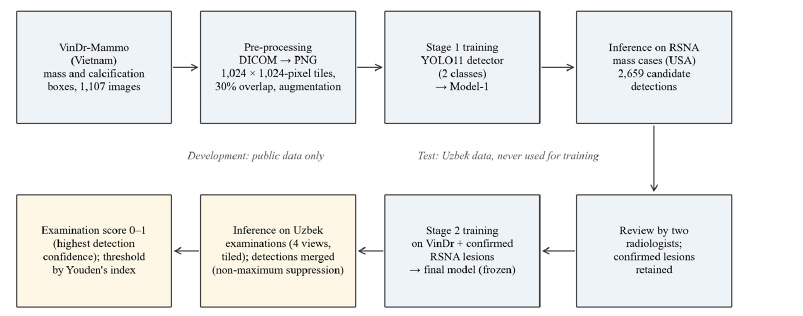
Supplementary Fig. S1. Development and testing pipeline of the AI model. Blue — development on public data only; yellow — application of the frozen model to the Uzbek test set
Supplementary File 2. Technical description of the AI model
Deep learning-based breast cancer detection on mammography in Uzbekistan: a multicentre retrospective study
1. Image acquisition and quality control
| Centre | Examinations | Mammography system | Detector; pixel size | Technical repeats, n (%) |
|---|---|---|---|---|
| Tashkent | 899 | Fujifilm AMULET Sophinity | a-Se direct conversion (hexagonal pixels); 50 µm | 30 (3.3) |
| Nukus | 557 | Fujifilm AMULET Sophinity | a-Se direct conversion (hexagonal pixels); 50 µm | 17 (3.1) |
| Samarkand | 303 | Fujifilm AMULET Sophinity | a-Se direct conversion (hexagonal pixels); 50 µm | 14 (4.6) |
Note: a-Se — amorphous selenium. All examinations: two-dimensional craniocaudal and mediolateral oblique views of both breasts; digital breast tomosynthesis was not used. Positioning and image quality were checked by the reporting radiologists according to the centres’ standard protocol; inadequate images were repeated before reporting.
2. Pre-processing
(a) Export of the images from the picture archiving and communication system in DICOM format; removal of all personal identifiers.
(b) Conversion from DICOM to 8-bit PNG using the DICOM window centre / width.
(c) Tiling of each image into 1,024×1,024-pixel patches with 30% overlap between neighbouring patches. The same tiling was used for training and inference.
(d) Training-time augmentation: Ultralytics defaults — mosaic, horizontal flip, random scaling and translation, HSV colour jitter. No augmentation at inference.
3. Model architecture and development partitions
Architecture: YOLO11 single-stage object detector (Ultralytics, version 11) [Jocher & Qiu, 2024], large configuration (YOLO11l; 25.3 million parameters). Backbone: convolutional layers with C3k2 blocks, spatial pyramid pooling — fast (SPPF) and a C2PSA (partial self-attention) module; neck: feature-pyramid / path-aggregation network; head: decoupled, anchor-free detection head at three scales. Input: 1,024×1,024-pixel tile. Output per tile: bounding boxes with class (mass or calcification) and confidence (0–1).
Initialisation: COCO-pretrained Ultralytics weights (yolo11l.pt; transfer learning).
Development data: stage 1 — VinDr-Mammo images containing mass or calcification annotations (1,107 images); a randomly selected subset of these images was held out for validation. Stage 2 — the stage 1 model (Model-1) was run on RSNA mass cases; 2,659 candidate detections were reviewed by two experienced radiologists and only confirmed lesions were added to the training data. No Uzbek examination was used at any stage of development. The development and test data are disjoint at patient, institution and country level.
4. Training
Loss: default Ultralytics detection loss — binary cross-entropy (classification) + complete intersection-over-union (CIoU) + distribution focal loss (box regression).
Optimiser and hyperparameters: Ultralytics defaults (optimizer «auto»), image size 1,024. The number of epochs, batch size and learning-rate schedule were not retained.
Model selection: checkpoint with the highest validation fitness (Ultralytics best.pt; 0.1×mAP50+0.9×mAP50–95). A single final model was used; no ensembling.
5. Inference and examination-level score
Each of the four two-dimensional views (left and right craniocaudal and mediolateral oblique) is tiled as in training; detections from overlapping tiles are merged by non-maximum suppression with a low confidence threshold, so that every examination receives a score. The examination score is the highest detection confidence over all detections of both classes in the four views (range 0–1; observed range in the test set 0.0006–0.9987). The operating threshold (0.495) was chosen by Youden’s index on the test set; this choice makes sensitivity and specificity optimistic and must be pre-specified in prospective use. The training annotations (mass, calcification) define what the detector localises; they do not establish which image features drive the examination score, and no saliency or other interpretability analysis was performed.
6. Software and hardware
Model development and inference: Python, PyTorch and the Ultralytics library (YOLO11). Statistical analysis: Python 3.13 (pandas, NumPy, SciPy, scikit-learn, statsmodels, Matplotlib).
REFERENCES
-
- Bray, F., Laversanne, M., Sung, H., Ferlay, J., Siegel, R. L., Soerjomataram, I., & Jemal, A. (2024). Global cancer statistics 2022: GLOBOCAN estimates of incidence and mortality worldwide for 36 cancers in 185 countries. CA: A Cancer Journal for Clinicians, 74(3), 229–263. doi: 10.3322/caac.21834.
- GBD 2023 Breast Cancer Collaborators (2026). Global, regional, and national burden of breast cancer among females, 1990–2023, with forecasts to 2050: a systematic analysis for the Global Burden of Disease Study 2023. The Lancet Oncology, 27(3), 302–326. doi: 10.1016/s1470-2045(25)00730-2.
- Anderson, B. O., Ilbawi, A. M., Fidarova, E., Weiderpass, E., Stevens, L., Abdel-Wahab, M., & Mikkelsen, B. (2021). The Global Breast Cancer Initiative: a strategic collaboration to strengthen health care for non-communicable diseases. The Lancet Oncology, 22(5), 578–581. doi: 10.1016/s1470-2045(21)00071-1.
- Duffy, S. W., Tabár, L., Yen, A. M., Dean, P. B., Smith, R. A., Jonsson, H., … Chen, T. H. (2020). Mammography screening reduces rates of advanced and fatal breast cancers: Results in 549,091 women. Cancer, 126(13), 2971–2979. doi: 10.1002/cncr.32859.
- Buist, D. S. M., Porter, P. L., Lehman, C., Taplin, S. H., & White, E. (2004). Factors Contributing to Mammography Failure in Women Aged 40–49 Years. JNCI Journal of the National Cancer Institute, 96(19), 1432–1440. doi: 10.1093/jnci/djh269.
- European Commission Initiative on Breast Cancer (2024). European guidelines on breast cancer screening and diagnosis. Ispra: Joint Research Centre. Retrieved from healthcare-quality.jrc.ec.europa.eu/ecibc.
- McKinney, S. M., Sieniek, M., Godbole, V., Godwin, J., Antropova, N., Ashrafian, H., … Shetty, S. (2020). International evaluation of an AI system for breast cancer screening. Nature, 577(7788), 89–94. doi: 10.1038/s41586-019-1799-6.
- Schaffter, T., Buist, D. S. M., Lee, C. I., Nikulin, Y., Ribli, D., Guan, Y., … Jung, H. (2020). Evaluation of Combined Artificial Intelligence and Radiologist Assessment to Interpret Screening Mammograms. JAMA Network Open, 3(3), e200265. doi: 10.1001/jamanetworkopen.2020.0265.
- Freeman, K., Geppert, J., Stinton, C., Todkill, D., Johnson, S., Clarke, A., & Taylor-Phillips, S. (2021). Use of artificial intelligence for image analysis in breast cancer screening programmes: systematic review of test accuracy. BMJ, n1872. doi: 10.1136/bmj.n1872.
- Lång, K., Josefsson, V., Larsson, A.-M., Larsson, S., Högberg, C., Sartor, H., … Rosso, A. (2023). Artificial intelligence-supported screen reading versus standard double reading in the Mammography Screening with Artificial Intelligence trial (MASAI): a clinical safety analysis of a randomised, controlled, non-inferiority, single-blinded, screening accuracy study. The Lancet Oncology, 24(8), 936–944. doi: 10.1016/s1470-2045(23)00298-x.
- Gommers, J., Hernström, V., Josefsson, V., Sartor, H., Schmidt, D., Hjelmgren, A., … Lång, K. (2026). Interval cancer, sensitivity, and specificity comparing AI-supported mammography screening with standard double reading without AI in the MASAI study: a randomised, controlled, non-inferiority, single-blinded, population-based, screening-accuracy trial. The Lancet, 407(10527), 505–514. doi: 10.1016/s0140-6736(25)02464-x.
- Eisemann, N., Bunk, S., Mukama, T., Baltus, H., Elsner, S. A., Gomille, T., … Katalinic, A. (2025). Nationwide real-world implementation of AI for cancer detection in population-based mammography screening. Nature Medicine, 31(3), 917–924. doi: 10.1038/s41591-024-03408-6.
- Elhakim, M. T., Stougaard, S. W., Graumann, O., Nielsen, M., Gerke, O., Larsen, L. B., & Rasmussen, B. S. B. (2024). AI-integrated Screening to Replace Double Reading of Mammograms: A Population-wide Accuracy and Feasibility Study. Radiology: Artificial Intelligence, 6(6), e230529. doi: 10.1148/ryai.230529.
- Yu, A. C., Mohajer, B., & Eng, J. (2022). External Validation of Deep Learning Algorithms for Radiologic Diagnosis: A Systematic Review. Radiology: Artificial Intelligence, 4(3), e210064. doi: 10.1148/ryai.210064.
- Goh, S., Goh, R. S. J., Chong, B., Ng, Q. X., Koh, G. C. H., Ngiam, K. Y., & Hartman, M. (2025). Challenges in Implementing Artificial Intelligence in Breast Cancer Screening Programs: Systematic Review and Framework for Safe Adoption. Journal of Medical Internet Research, 27, e62941. doi: 10.2196/62941.
- President of the Republic of Uzbekistan (2024). Resolution № PP-358 of 14 October 2024 on the approval of the Strategy for the development of artificial intelligence technologies until 2030. Tashkent. Retrieved from lex.uz/docs/7159258 [Uzbek].
- President of the Republic of Uzbekistan (2024). Resolution № PP-402 of 22 November 2024 on measures to improve the system of control of oncological diseases among women. Tashkent. Retrieved from lex.uz/docs/7232845 [Uzbek].
- Tejani, A. S., Klontzas, M. E., Gatti, A. A., Mongan, J. T., Moy, L., Park, S. H., … Zins, M. (2024). Checklist for Artificial Intelligence in Medical Imaging (CLAIM): 2024 Update. Radiology: Artificial Intelligence, 6(4), e240300. doi: 10.1148/ryai.240300.
- American College of Radiology (2025). ACR BI-RADS® v2025 Manual. Reston, VA: American College of Radiology. Retrieved from http://www.acr.org/Clinical-Resources/Clinical-Tools-and- Reference/Reporting-and-Data-Systems/BI-RADS.
- Jocher, G., & Qiu, J. (2024). Ultralytics YOLO11 (Version 11.0.0) [Computer software]. Ultralytics. Retrieved from github.com/ultralytics/ultralytics.
- Nguyen, H. T., Nguyen, H. Q., Pham, H. H., Lam, K., Le, L. T., Dao, M., & Vu, V. (2023). VinDr-Mammo: A large-scale benchmark dataset for computer-aided diagnosis in full-field digital mammography. Scientific Data, 10(1), 277. doi: 10.1038/s41597-023-02100-7.
- Carr, C., Kitamura, F., Kalpathy-Cramer, J., Mongan, J., Andriole, K., Vazirabad, M., … Stein, A. (2022). RSNA Screening Mammography Breast Cancer Detection [Data set]. Kaggle. Retrieved from http://www.kaggle.com/competitions/rsna-breast-cancer-detection.
- Pedemonte, S., Tsue, T., Mombourquette, B., Truong Vu, Y. N., Matthews, T., Morales Hoil, R., … Wahl, R. L. (2024). A Semiautonomous Deep Learning System to Reduce False Positives in Screening Mammography. Radiology: Artificial Intelligence, 6(3), e230033. doi: 10.1148/ryai.230033.
- Hsu, W., Hippe, D. S., Nakhaei, N., Wang, P.-C., Zhu, B., Siu, N., … Lee, C. I. (2022). External Validation of an Ensemble Model for Automated Mammography Interpretation by Artificial Intelligence. JAMA Network Open, 5(11), e2242343. doi: 10.1001/jamanetworkopen.2022.42343.
- Kwon, M.-r., Chang, Y., Ham, S.-Y., Cho, Y., Kim, E. Y., Kang, J., … Ryu, S. (2024). Screening mammography performance according to breast density: a comparison between radiologists versus standalone intelligence detection. Breast Cancer Research, 26(1), 68. doi: 10.1186/s13058-024-01821-w.
- van Winkel, S. L., Samperna, R., Loehrer, E. A., Kroes, J., Rodriguez-Ruiz, A., & Mann, R. M. (2025). Using AI to Select Women with Intermediate Breast Cancer Risk for Breast Screening with MRI. Radiology, 314(2), e233067. doi: 10.1148/radiol.233067.
- Youden, W. J. (1950). Index for rating diagnostic tests. Cancer, 3(1), 32–35. doi: 10.1002/1097-0142(1950)3:1<32::aid-cncr2820030106>3.0.co;2-3.
- Vachon, C. M., van Gils, C. H., Sellers, T. A., Ghosh, K., Pruthi, S., Brandt, K. R., & Pankratz, V. S. (2007). Mammographic density, breast cancer risk and risk prediction. Breast Cancer Research, 9(6), 217. doi: 10.1186/bcr1829.
- Collaborative Group on Hormonal Factors in Breast Cancer (2001). Familial breast cancer: collaborative reanalysis of individual data from 52 epidemiological studies including 58 209 women with breast cancer and 101 986 women without the disease. The Lancet, 358(9291), 1389–1399. doi: 10.1016/s0140-6736(01)06524-2.
- Collaborative Group on Hormonal Factors in Breast Cancer (2019). Type and timing of menopausal hormone therapy and breast cancer risk: individual participant meta-analysis of the worldwide epidemiological evidence. The Lancet, 394(10204), 1159–1168. doi: 10.1016/s0140-6736(19)31709-x.
Адреса для листування:
Тохтамуратов Умід
Узбекистан, 100179, м. Ташкент, вул. Фаробі, 383
Республіканський спеціалізований науково-практичний
медичний центр онкології та радіології
E-mail: umidrifkatov@gmail.com
Correspondence:
Umid Tokhtamuratov
383 Farobi str., Tashkent, 100179, Uzbekistan
Republican Specialized Scientific and Practical Medical Center
of Oncology and Radiology
E-mail: umidrifkatov@gmail.com


Leave a comment